Business intelligence and business analytics are both important data management systems that provide real opportunities for company growth. While the two terms may sometimes be used interchangeably, in reality there are key differences that help separate them.
In order to determine which will currently be the most useful for your business, it's obviously vital that you have a solid understanding of each and what they can offer. In today's article we'll compare the two, and explain exactly how they can both be used to deliver crucial insights to fuel all kinds of business decisions.
Why Use Data in Decision Making?
Data is now more important than ever; we're generating it on a monster scale, and the arrival of big data is changing the business landscape every day. It's no surprise then that businesses that utilise data in the most effective way when it is available to them, using it to drive better, more accurate choices, are ahead of their rivals. Indeed, a BI Survey study on the matter revealed that organisations that are data-driven enjoyed 6% more profits and 4% more productivity.
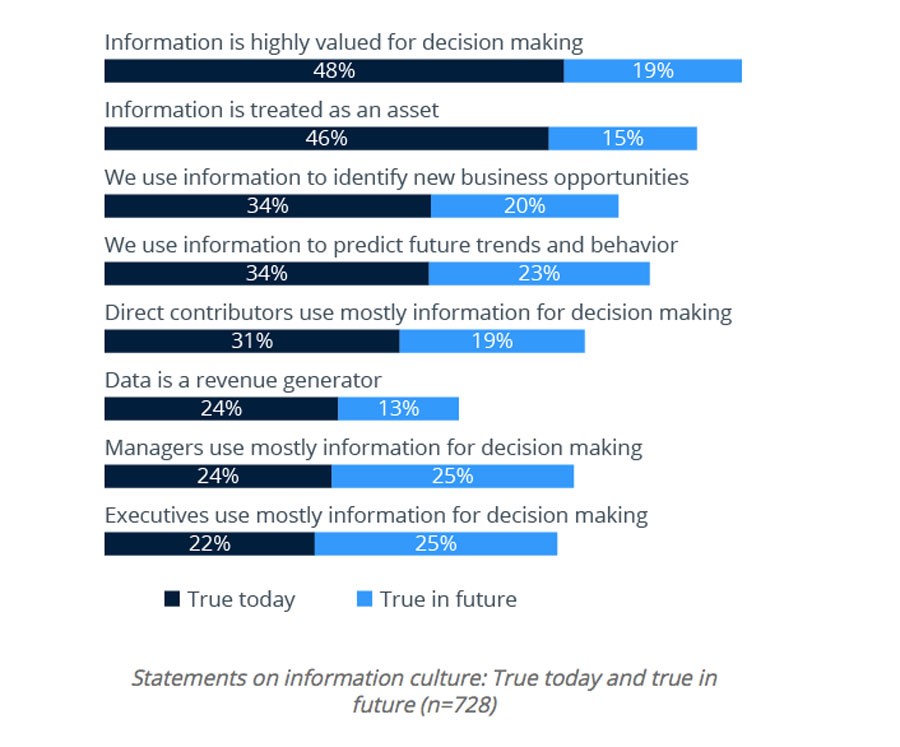
Despite this, many organisations aren't utilising data to the full advantage - take a look at the chart below via BI Survey. It shows that less than half of businesses see data as highly valued, or treat it as an asset. This needs to change - and business intelligence and analytics are the perfect place to start.
Business Analytics vs Business Intelligence: The Definitions
Now let's get right to it and look at the specific meanings behind bi and analytics. There may be a few disparities in the definitions depending on who you ask, but these are the most widely used versions across the board today.
What is BI?
Business intelligence involves using tools and systems to spot patterns in a certain dataset. It allows us to dig deep in our company's data (or that of another organisation), and find useful insights that can then fuel future business choices. It mainly revolves around the past, and telling you what has happened without delving in too deep regarding the reasons for these trends or changes.
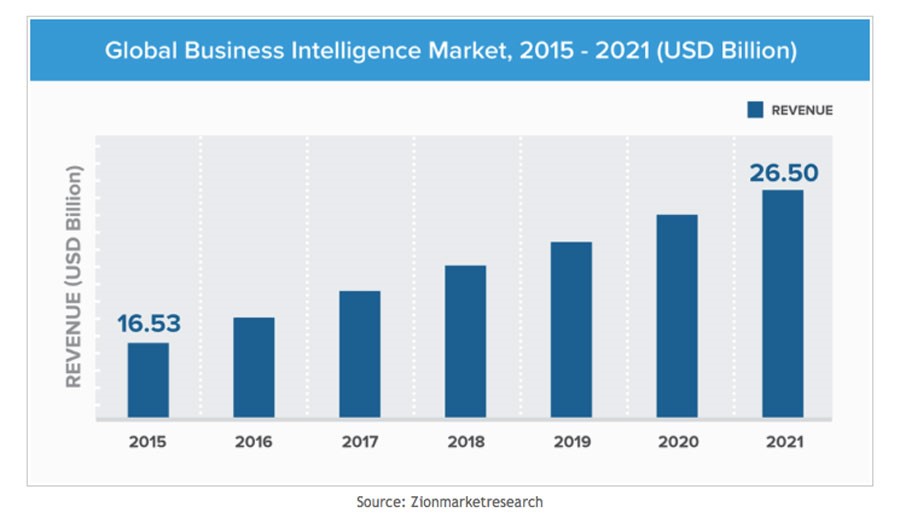
As is shown in the chart below from Zionmarketresearch, business intelligence has become a huge market, predicted to reach $26.5 billion by 2021.
What is BA?
Business analytics also has the same goal of providing useful insights for your decision making. However, in contrast to BI, it gives you a more in-depth look at the particular reasons why something happened. It also uses these insights to make helpful predictions about potential future trends, allowing you to prepare accordingly, and improve your business operations.
According to research from Gartner, by 2020 over 75% of large and medium-sized businesses will use advanced analytics as part of a platform, helping to fuel improved decisions for their organisations.
Does BA Come Under BI?
Another potentially confusing part of distinguishing between BI and BA is the fact that, to some, business intelligence actually comes under the umbrella of business analytics, and vice versa. One argument is based on BA being essentially a self-service arm of BI. While traditionally business intelligence involves more advanced tools and IT professionals, today it is much more accessible to those without real technological know-how. This wave of self-service business intelligence has therefore been deemed the definition of BA by some.
In case you need more evidence of what a grey area this is, there are also those who argue that business intelligence is actually a part of business analytics. They see BA as the main umbrella term, with everything from predictive analytics to data warehousing falling under it, with BI being just one more arm included in it.
Because these terms are relatively new in the grand scheme of things, there is currently not a general consensus surrounding their exact definitions. However, as we've mentioned above, there are fundamental differences between business intelligence and analytics to set them apart.
How do BI and Analytics Compare?
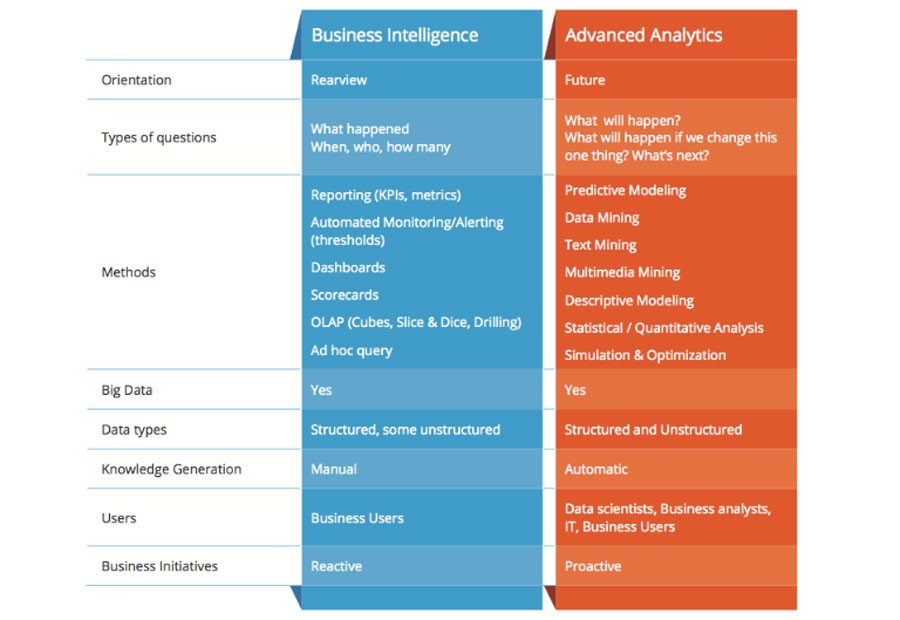
When performing a business intelligence vs analytics comparison, there are several factors to take into consideration. Because their overall goal of using data to drive business growth is the same, of course there are areas of overlap between them. However, they also differ in several key areas. Let's take a closer look at some of these aspects of both, starting with this useful comparison below taken from RapidMinder.
Data Visualisation
While both BI and BA can make use of visualisation tools as part of their process, it is more likely to be utilised in the realm of business intelligence. This is because it centres around the report of data, as opposed to its analysis, so it is therefore an ideal asset for making trends and patterns in the dataset easier to digest.
Descriptive Analytics
Descriptive analytics is one of the key aspects of business intelligence. It involves processing usually large amounts of data in order to be able to more easily spot trends and patterns. The goal is to take structured or unstructured data and use it to learn from the past, giving you a much deeper understanding of your business, your competitors, or your customers.
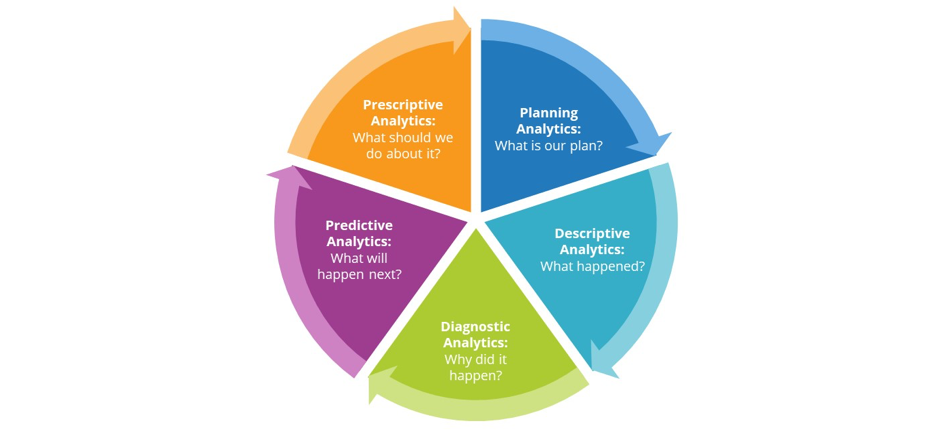
As is shown in the image below by IBM, descriptive analytics is one of the essential steps in the entire analytics process.
Diagnostic Analytics
While descriptive analytic is focused on discovering what happened, diagnostic analytics is designed to find out the reasons behind it. This makes it an important part of BA, as opposed to BI. Diagnostic analytics means looking at the causes, not just the results. For example, while descriptive analytics may provide you with insights such as sales statistics for a specific place or time, diagnostic analytics will help determine why there were more sales in a particular month, or in a particular city.
Predictive Analytics
So we've not got the what and the why covered - and predictive analytics is essentially the 'what next?'. It is a part of business analytics, as it involves using company data to make forecasts and predictions for the future. While no computer software can be completely certain of an outcome, the tools used for predictive modelling allow you to establish how likely something is to happen. This can obviously be extremely useful when it comes to things like forecasting sales figures to ensure that you're not wasting money buying too much inventory.
Prescriptive Analytics
Prescriptive analytics is a relatively new technique and is therefore not being used by too many businesses. It allows you to see the likely outcomes of several different approaches or events, so that you can then choose the best and adapt your strategy accordingly. Prescriptive analytics comes under the umbrella of business analytics, and is particularly complicated to implement and manage, which is why, of the few companies that have introduced it, it is mainly the larger ones.
Business Intelligence vs Analytics: In Summary
It could seem a bit daunting trying to sort the exact difference between business intelligence and business analytics, the key takeaway remains pretty simple. Just keep in mind this: business intelligence allows users to find out what's currently happening in their business, or has in the past, whilst business analytics provides users with reasons why, alongside providing useful predictions.

Choosing Between Business Intelligence and Analytics
The main reason that distinguishing between BA and BI is so important is because at some point you may have to decide between them. Which one will be most valuable to your business at the moment? Whichever one you decide on, you'll of course need the right tools, systems and possibly people you need in place in order to implement it effectively.
Neither BA nor BI are better or more important than the other - it all comes down to what you're looking to gain from your dataset. To help you make the right choice between them, consider the following factors:
Your Goals
Obviously, the biggest factor in making your business intelligence vs business analytics decision is ultimately what you're hoping to gain from it. What are your company's current most pressing challenges or concerns? What insights do you need to derive in order to be able to make changes and improvements?
If you're wanting to understand more about your current performance, for example who your customers are or how saturated a specific market currently is, you should pick business intelligence. If you're more concerned with things that are likely to occur further down the line, e.g. which will be your busiest month sales-wise, business analytics is a safer bet for you.

Your Current Infrastructure
If your company has a tight budget when it comes to buying technology or potentially having to outsource work or hire new staff, you may need to factor this into your decision. While business intelligence was once limited to huge organisations with the ability to fork out large sums for the right tools, nowadays anyone can perform it without the need to be particularly tech-savvy.
Business analytics meanwhile, may require someone who has a specialised knowledge in the field, alongside more complex tools and systems.
The Data
If you’re working with a specific dataset, you should also consider whether there are any limitations to the types of insights it can provide. Your own sales figures, for example, will only provide so much information; if you’re looking for something more detailed to fuel business growth or enter a new market it’s likely you’ll require some quality third-party data.
Tools for Business Intelligence and Business Analytics
To get the most out of your BI or BA strategy, you need to first ensure that you're using the most efficient tools that offer the greatest value for money. Here is our pick of a few of the most popular tools on the market today, to help you decide which ones suit your company.
Sisense
This is a comprehensive analytics tools that not only allows you to transform text-based data into valuable insights, but also to gain predictions and forecasts for likely trends. It provides advanced features that allow for processing statistics like covariance and correlation, and also gives you the chance to carry out web analytics via Google analytics.
While the tool is a great asset for anyone with experience in analytics, it is likely to be overwhelming and too complex for those completely new to the field.
Tableau
Tableau is one of the oldest players in the game, and is therefore a very popular and well-trusted tool. It provides users with the features needed to process and analyse large sets of data, gaining comprehensive insights as a result. You can analyse your performance on social media as well as providing tools for forecasting trends.
Although it has a user-friendly design, as with Sisense it is likely to be a bit tricky for those without the right level of tech-savviness.
Dundas BI
Dundas BI is a comprehensive yet easily accessible business intelligence tool that is used by businesses of all sizes. It enables users to learn more about their current performance, offering visualisations in real-time, along with useful insights. It offers stringent security measures, so any data stored is kept in safe hands.
Microsoft Power BI
As well as offering a full desktop version, you can also make use of the free BI tool from Microsoft. While it doesn't include as many features as the paid version, it allows you to transform data (including that stored in Excel spreadsheets) into something more visually appealing. One of the biggest advantages of the tool is its ease of use - you don't need any specific technological know-how in order to make full use of it.
Third-Party Data for BI and BA
As well as gaining insights from your own internal data, there are often times when you might need to include data from other sources in order to get accurate and in-depth insights.
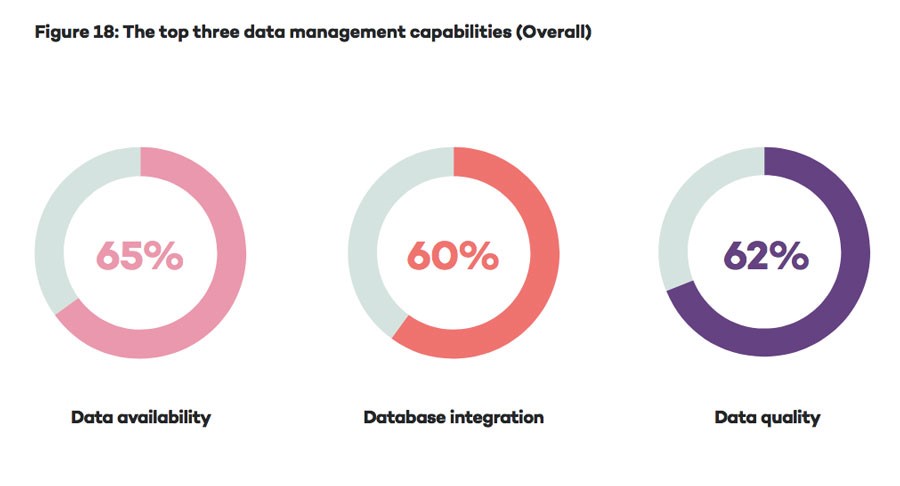
Thankfully, it is now easier than ever to access better quality data, as the charts below taken from the 2017 Data-Driven Marketing Report show, with the majority of businesses stating that availability and quality are two of their biggest assets when it comes to data.
Here are some of the best sources of third-party data currently available:
Data.gov.uk
If you're looking for UK-based information, this is a great place to start. The UK government's open data portal makes it easy to access datasets on a range of different topics; everything from transport and environment to crime and education. It's all provided free of charge, and the website is simple to use.
Companies House
If you're looking for data on a specific company in the UK, Companies House is a good place to start. It offers information such as financial records and annual accounts, and details on current and previous directors and secretaries. The data is all provided free of charge, but keep in mind that it is pretty limited, and there's no filter or browse options so it's really only useful if you have a particular organisation in mind.
D&B Hoovers
Hoovers offers more in-depth information on millions of companies. You can view data such as financials, company structure and ownership, and contact data. As one of the best-known company data providers, it's monthly subscriptions can be rather pricey for SMEs or startups.
Global Database
Another option for those looking for accurate company data, Global Database offers millions of records for businesses worldwide. It's easily filterable so you can segment based on the types of companies you're looking to learn more about. It offers historical and current financial data, employee numbers, technologies used, credit scores and more. Access is via an annual subscription that is much less expensive than others on the market.
Zoominfo
Zoominfo is another business intelligence provider, offering company data and contact details. It enables users to build up a profile of each business listed, as well as gain general insights into a specific niche or market. Unlike some other providers such as Global Database, the platform isn't guaranteed to be updated every single day, so data is at risk of becoming stale.
Keeping in mind the information above, what would be the best for your business - BI or BA? We hope the infographic below will help you make the choice or even benefit from the both.

Using BI in Business
As we've discussed earlier, business intelligence allows you to see the 'what' in your organisation. It provides insights into your current performance, as well as that of your competitors or the market as a whole. In order to have a hope of growing your business, you need to first understand what is going on in your everyday operations, and exactly how well you're performing.
Let's say for example that you're running a collection of clothing retail stores. In order to gain a more detailed view of how your overall business is performing, you need to first break things down a bit and answer specific questions. This would include things like:
-
Which store are pulling in the most cash?
-
Which products are selling the best?
-
Which day of the week is seeing the most sales?
-
Which time of the year are you generating the most revenue?
Answering these types of questions is a fundamental part of business intelligence. You'd need to collect and process your data in order to find the results you need, and then possibly turn it into charts, graphs or other visualisations, or an overall report.
As well as looking at your own data, it can be extremely beneficial to look at that belonging to other organisations. The Global Database platform makes business intelligence very simple in this regard. It can help you answer those 'what' questions such as how saturated a market is.
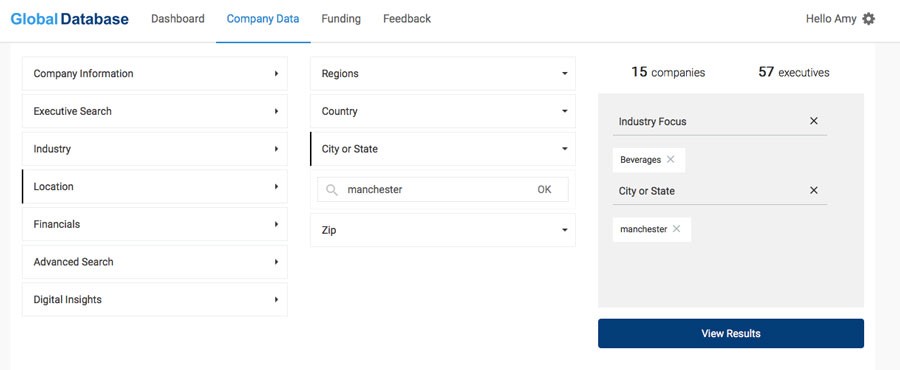
Because the database has a wide range of filter tools, you're able to segment based on particular preferences. In order to find out how competitive a new market is, for example, you could filter by industry and/or location, and then see how many active businesses there are.
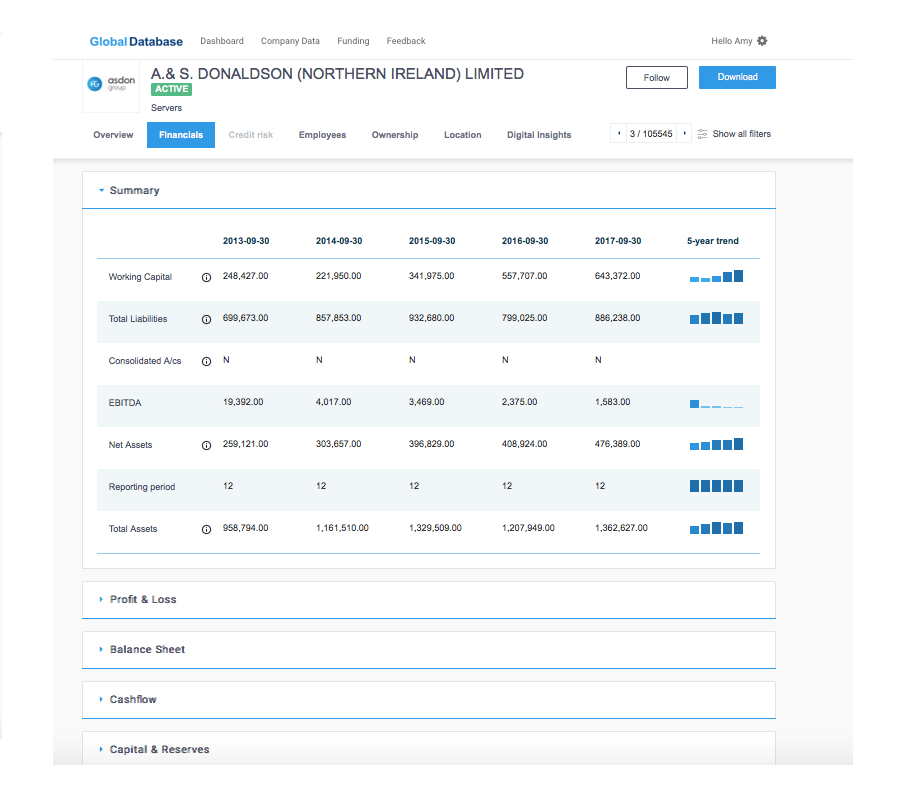
Monitoring your rivals financial performance is also incredibly useful. Global Database provides financial records for the last twenty years, as well as constant updates to keep the data as fresh as possible. You can see whether a company's revenue has increased or decreased, or just compare it with your own figures to see how you're measuring up currently.
Using BA in Business
By implementing business analytics into your company, you'll also be able to answer the 'why' as well as the 'what'. This is particularly useful when it comes to making big changes, such as entering a new market or launching a new product; you need to be able to understand the reasons behind specific events or trends in order to adapt your strategy accordingly.
Using business analytics will also mean you can make predictions for how well your new launch, for example, is likely to perform, so you can manage expectations and make the necessary preparations well in advance.
If we take it back to the example of running clothing stores, you might want to learn more about the reasons behind certain facts and figures. The aim of BA would be to allow you to find out why a particular store is outperforming the others; does it have a better reputation, more footfall, a superstar salesperson? When you have this information to hand, you would then be able to replicate it across your other stores.
Global Database can also help with looking at the 'why' behind your competitor's performance. If you find that their sales revenues have been increasing or decreasing, why not dig a little deeper for the reasons behind this? For example, you could check whether their website has also seen an increase in traffic; if they're getting more hits than you are then you'll probably want to flag this issue in your marketing strategy.
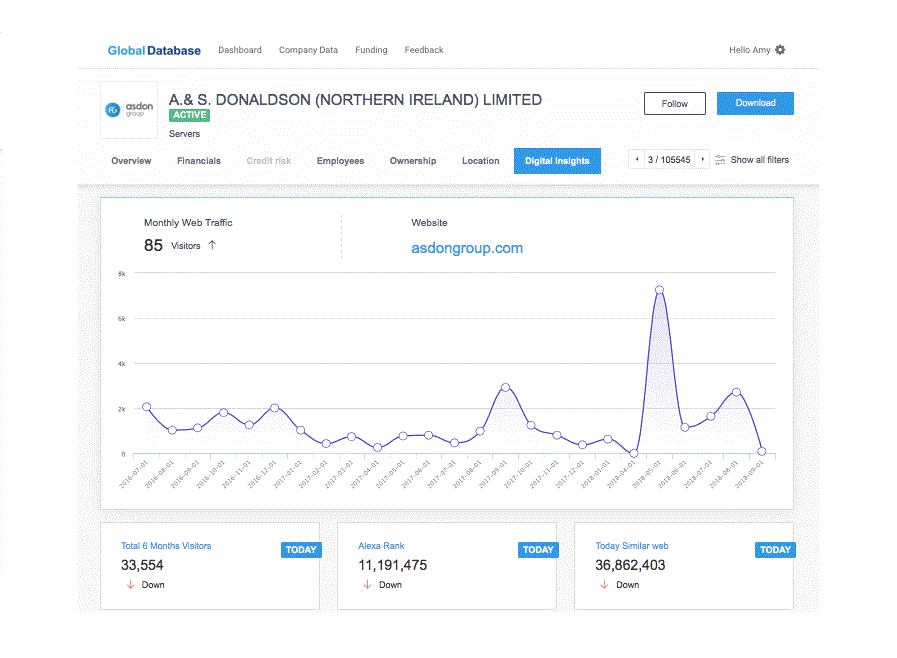
You could also look at how much of their traffic is organic, and how much is via referral, as well as the types of keywords that they’re currently ranking for.
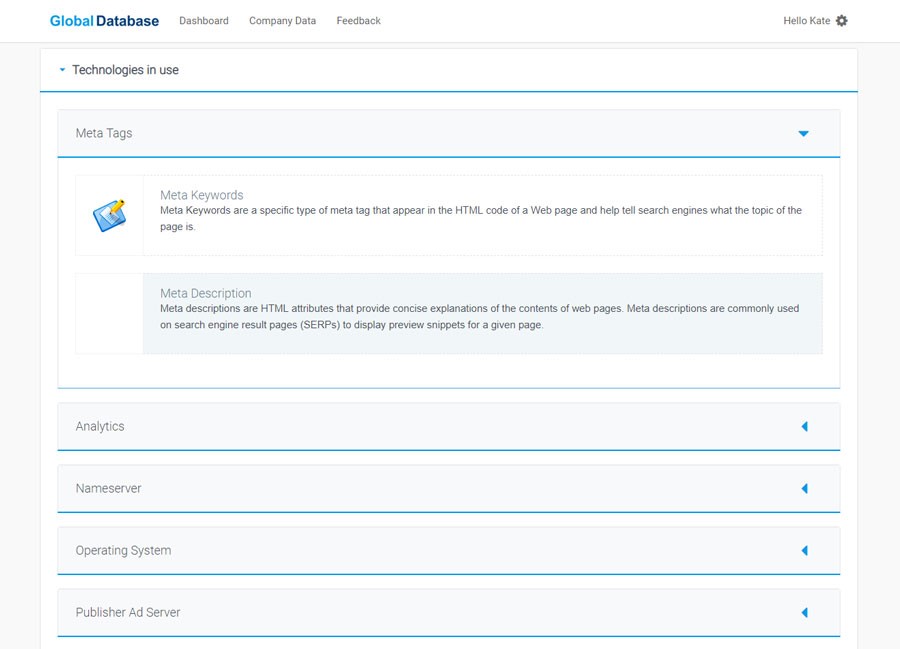
Global Database also provides information regarding the specific technologies that a company is using. As well as determining which ones are most prominent in your industry, you can also check whether your business rivals are more technologically advanced than you - another potential reason for them possibly enjoying higher sales figures.
Global Database for BI and Analytics
Global Database is a perfect companion for both your BI and BA strategies. Our platform holds data on millions of companies, and is all carefully analysed and presented with usability in mind. Our users can access comprehensive reports on organisations across practically every industry, providing them with a solid background for entering new markets, performing competitive analysis, or as a complete solution for their sales and marketing needs.
We offer instant access to information such as financials, employee details, direct contact details, technology insights, credit scores, ownership and structure data, and more. Our multiple filters make it incredibly easy to search and segment, so you can find organisations based on your specific requirements, whether you're researching the market or looking for new leads.
How do we Collect Our Data?
Our platform offers all the business intelligence you need in once place, so you don't have to waste time collecting it manually. This is particularly important given that recent research from Sage found that SMEs in the UK are currently wasting around 120 hours every year on basic admin tasks. If this time was spent productively, it would add a staggering £33.9 billion to the British economy annually.
We use multiple sources in order to make sure it is as comprehensive as possible. These include government agencies, Chambers of Commerce, Companies House, web and phone research, patented web-crawling technology and partnerships with reliable data providers.
Data Quality and Business Intelligence
Effective business intelligence and analytics require access to accurate and complete data. Using lacklustre or stale data will mean that your insights aren't based on the current facts, and your predictions and forecasts could be off.

Making sure you're working with high quality data can have an extremely positive effect on your business. In fact, research from Halo found that it can result in a decrease of up to 40% of operating costs, and an increase of 15-20% in revenues. Clearly, the impact of clean, fresh data cannot be underestimated.
We take our commitment to data quality incredibly seriously, and we ensure our database is always as accurate and up to date as possible. We do so in a number of different ways:
-
Data collected from reputable and varied sources every day
-
Patented web-crawling technology to add and update records in real time
-
In-house team to manually collect, organise and correct datasets
-
Emails validated every 30 days
To Sum Up...
It may be somewhat tricky to tell business intelligence and business analytics apart, but we hope we've cleared things up for you at least a little in this article. Ultimately the two have the same goal; to improve a business strategy based on more informed and better decisions. However, they differ somewhat in their approach.
Remember; business intelligence is based primarily around the past and leading up to the current performance of a company, while business analytics is more involved in making predictions about its future, as well as digging deeper and answering 'why'.
